Auto Accidents(1975-2017)
Import cuxfilter
[1]:
import cuxfilter
from cuxfilter import charts
from cuxfilter.layouts import feature_and_base
[2]:
#update data_dir if you have downloaded datasets elsewhere
DATA_DIR = './data'
Download required datasets
[3]:
from cuxfilter.sampledata import datasets_check
datasets_check('auto_accidents', base_dir=DATA_DIR)
Dataset - ./data/auto_accidents.arrow
dataset already downloaded
[4]:
cux_df = cuxfilter.DataFrame.from_arrow('./data/auto_accidents.arrow')
cux_df.data['ST_CASE'] = cux_df.data['ST_CASE'].astype('float64')
Define Charts
[5]:
# add mappings for day of week
label_map = {
1: 'Sunday',
2: 'Monday',
3: 'Tuesday',
4: 'Wednesday',
5: 'Thursday',
6: 'Friday',
7: 'Saturday',
9: 'Unknown'
}
gtc_demo_red_blue_palette = [ (49,130,189), (107,174,214), (123, 142, 216), (226,103,152), (255,0,104) , (50,50,50) ]
[6]:
from bokeh.tile_providers import get_provider as gp
tile_provider = gp('CARTODBPOSITRON')
Uncomment the below lines and replace MAPBOX_TOKEN with mapbox token string if you want to use mapbox map-tiles. Can be created for free here -https://www.mapbox.com/help/define-access-token/
[7]:
#from cuxfilter.assets.custom_tiles import get_provider, Vendors
#tile_provider = get_provider(Vendors.MAPBOX_LIGHT, access_token=MAPBOX_TOKEN)
[8]:
chart1 = charts.datashader.scatter_geo(x='dropoff_x', y='dropoff_y', aggregate_col='ST_CASE',
tile_provider=tile_provider,
color_palette=gtc_demo_red_blue_palette,)
chart2 = charts.bokeh.bar('YEAR')
chart3 = charts.panel_widgets.multi_select('DAY_WEEK', label_map=label_map)
Create a dashboard object
[9]:
d = cux_df.dashboard([chart1, chart3, chart2], layout=cuxfilter.layouts.feature_and_base,theme = cuxfilter.themes.rapids, title='Auto Accident Dataset')
[10]:
#dashboard object
d
[10]:
Starting the dashboard
d.show(‘current_notebook_url:current_notebook_port’) remote dashboard
d.app(‘current_notebook_url:current_notebook_port’) inline in notebook (layout is ignored, and charts are displayed one below another)
Incase you need to stop the server:
d.stop()
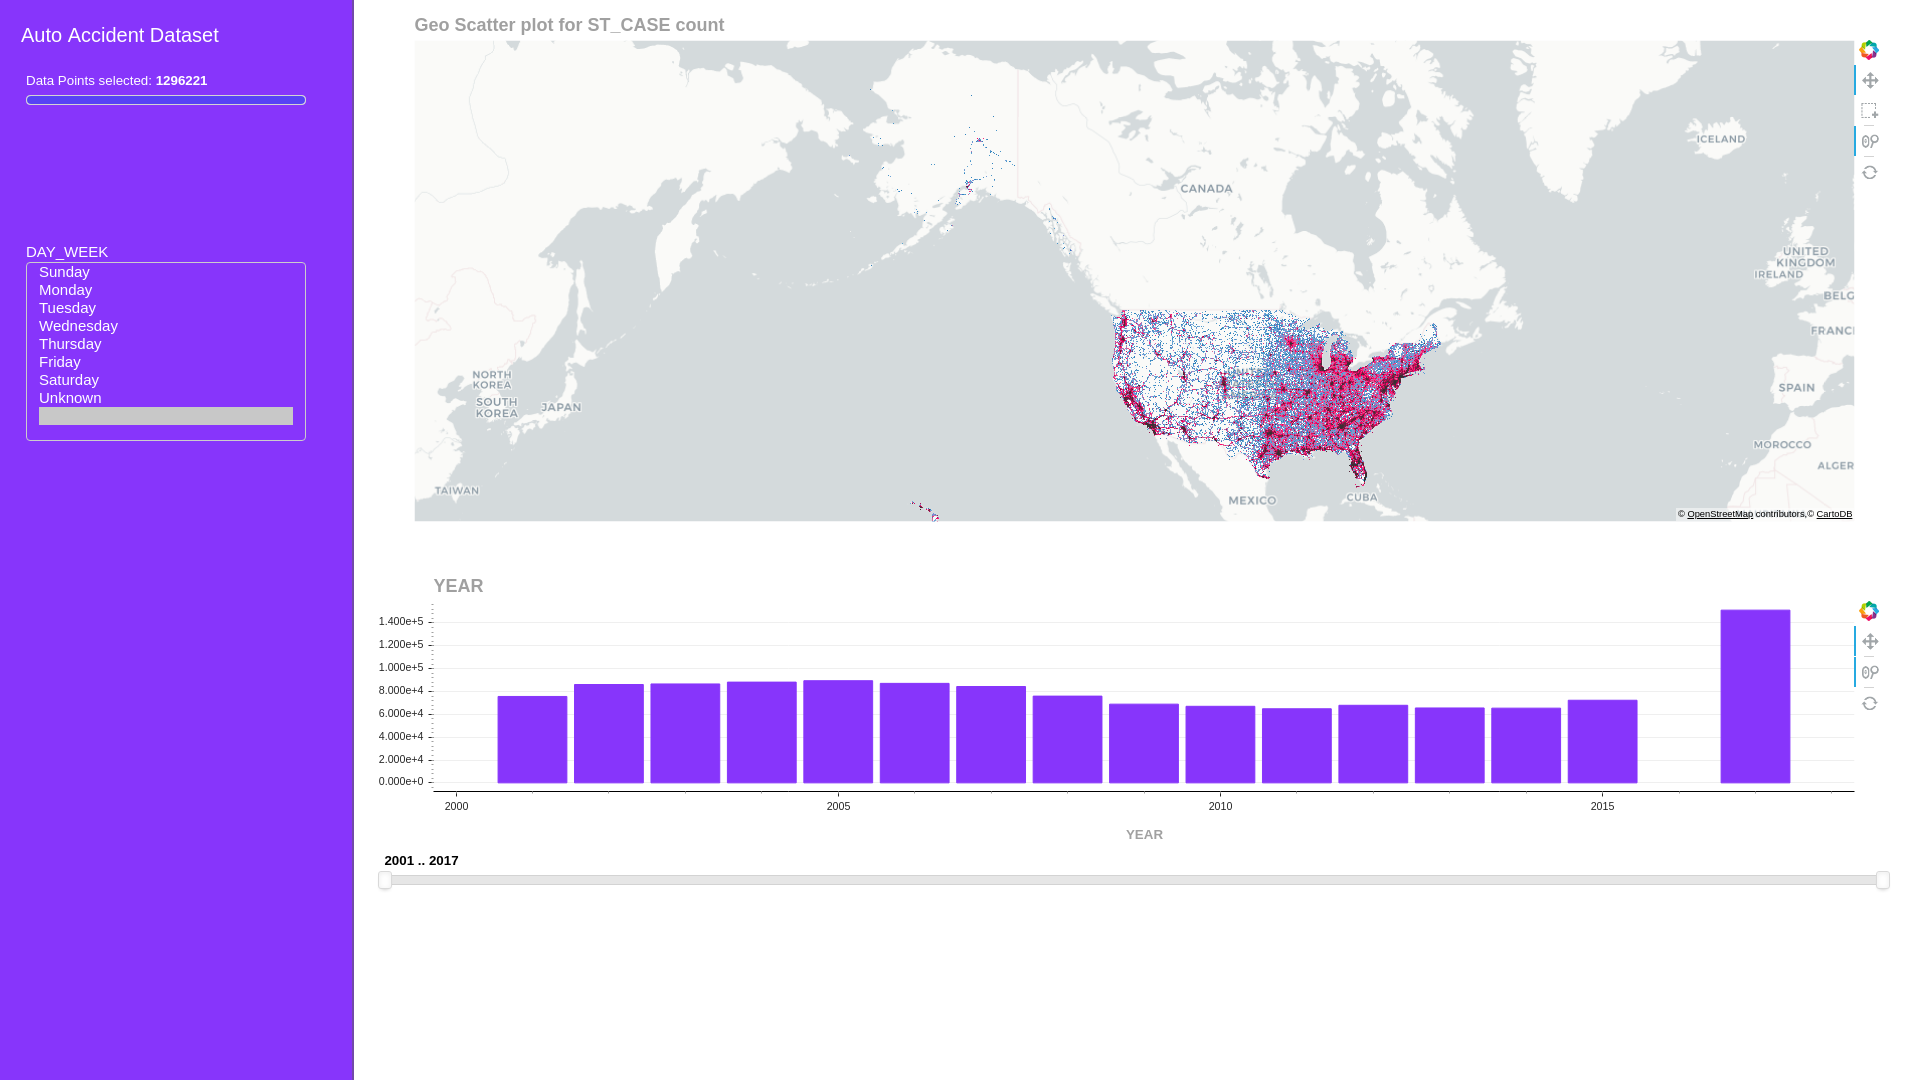
[11]:
await d.preview()
Export the queried data into a dataframe
[12]:
queried_df = d.export()
no querying done, returning original dataframe