NYC Taxi data
Import cuxfilter
[1]:
from cuxfilter import charts
import cuxfilter
from bokeh import palettes
from cuxfilter.layouts import double_feature
import cudf
[2]:
#update data_dir if you have downloaded datasets elsewhere
DATA_DIR = './data'
Download required datasets
[3]:
from cuxfilter.sampledata import datasets_check
datasets_check('nyc_taxi', base_dir=DATA_DIR)
Dataset - ./data/nyc_taxi.csv
dataset already downloaded
preprocess the data
[4]:
!pip install pyproj
cudf_df = cudf.read_csv('./data/nyc_taxi.csv')
from pyproj import Proj, transform
inProj = Proj(init='epsg:4326') # Latitude and longitudes
outProj = Proj(init='epsg:3857') # 2D projected points
cudf_df['dropoff_x'], cudf_df['dropoff_y'] = transform(inProj, outProj, cudf_df['dropoff_longitude'].to_array(), cudf_df['dropoff_latitude'].to_array()) # Apply transformation
cudf_df = cudf_df.drop(['dropoff_latitude', 'dropoff_longitude'], axis=1)
cudf_df = cudf_df.dropna(axis=0)
cudf_df = cudf_df[(cudf_df.dropoff_x > -8239910.23) & (cudf_df.dropoff_x < -8229529.24) & (cudf_df.dropoff_y > 4968481.34) & (cudf_df.dropoff_y < 4983152.92)] # Filter over Manhattan
cudf_df.head()
Requirement already satisfied: pyproj in /home/ajay/anaconda3/envs/cudf_0.10/envs/test_new/lib/python3.7/site-packages (2.4.1)
[4]:
| VendorID | tpep_pickup_datetime | tpep_dropoff_datetime | passenger_count | trip_distance | pickup_longitude | pickup_latitude | RateCodeID | store_and_fwd_flag | payment_type | fare_amount | extra | mta_tax | tip_amount | tolls_amount | improvement_surcharge | total_amount | dropoff_x | dropoff_y | |
|---|---|---|---|---|---|---|---|---|---|---|---|---|---|---|---|---|---|---|---|
| 0 | 2 | 2015-01-15 19:05:39 | 2015-01-15 19:23:42 | 1 | 1.59 | -73.993896 | 40.750111 | 1 | N | 1 | 12.0 | 1.0 | 0.5 | 3.25 | 0.00 | 0.3 | 17.05 | -8.234835e+06 | 4.975627e+06 |
| 1 | 1 | 2015-01-10 20:33:38 | 2015-01-10 20:53:28 | 1 | 3.30 | -74.001648 | 40.724243 | 1 | N | 1 | 14.5 | 0.5 | 0.5 | 2.00 | 0.00 | 0.3 | 17.80 | -8.237021e+06 | 4.976875e+06 |
| 3 | 1 | 2015-01-10 20:33:39 | 2015-01-10 20:35:31 | 1 | 0.50 | -74.009087 | 40.713818 | 1 | N | 2 | 3.5 | 0.5 | 0.5 | 0.00 | 0.00 | 0.3 | 4.80 | -8.238124e+06 | 4.971127e+06 |
| 4 | 1 | 2015-01-10 20:33:39 | 2015-01-10 20:52:58 | 1 | 3.00 | -73.971176 | 40.762428 | 1 | N | 2 | 15.0 | 0.5 | 0.5 | 0.00 | 0.00 | 0.3 | 16.30 | -8.238108e+06 | 4.974457e+06 |
| 5 | 1 | 2015-01-10 20:33:39 | 2015-01-10 20:53:52 | 1 | 9.00 | -73.874374 | 40.774048 | 1 | N | 1 | 27.0 | 0.5 | 0.5 | 6.70 | 5.33 | 0.3 | 40.33 | -8.236193e+06 | 4.976740e+06 |
Define charts
[6]:
from bokeh.tile_providers import get_provider as gp
tile_provider = gp('CARTODBPOSITRON')
Uncomment the below lines and replace MAPBOX_TOKEN with mapbox token string if you want to use mapbox map-tiles. Can be created for free here -https://www.mapbox.com/help/define-access-token/
[7]:
#from cuxfilter.assets.custom_tiles import get_provider, Vendors
#tile_provider = get_provider(Vendors.MAPBOX_LIGHT, access_token=MAPBOX_TOKEN)
[8]:
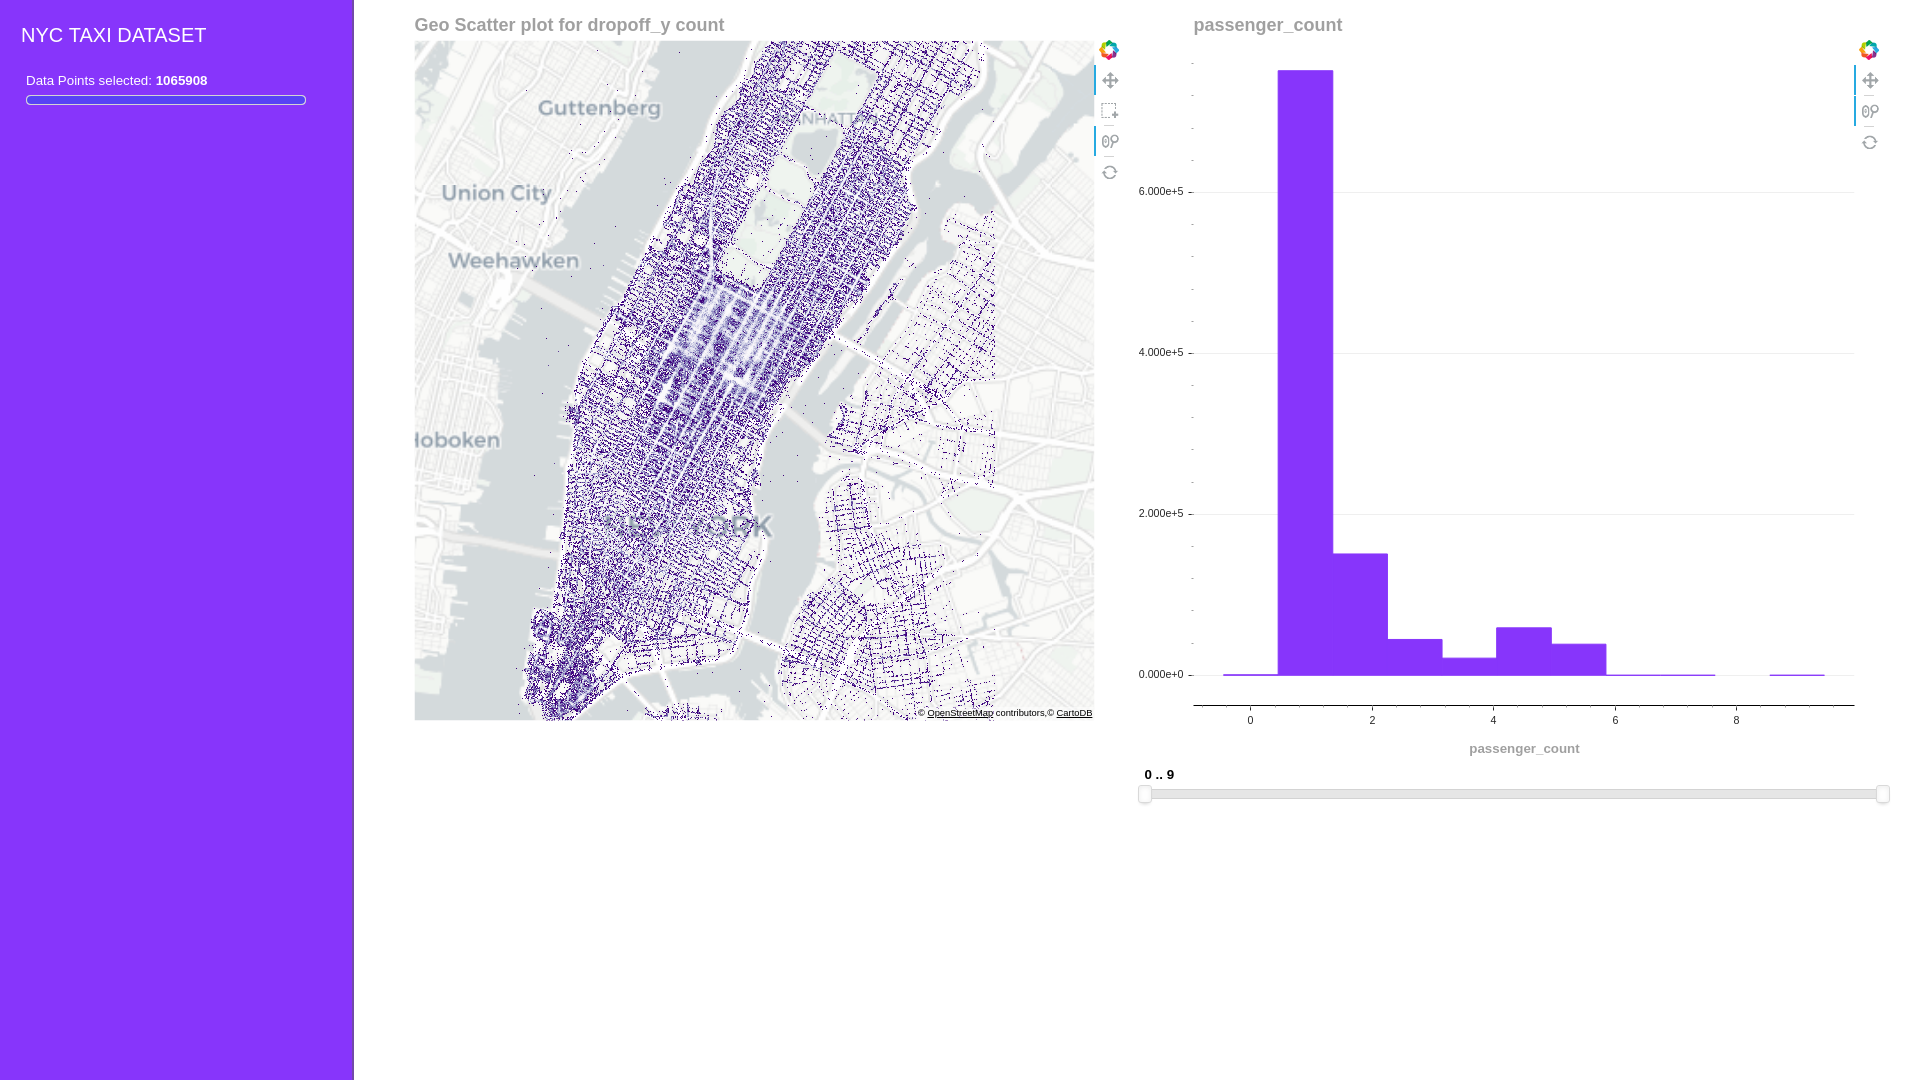
chart1 = charts.datashader.scatter_geo(x='dropoff_x',
y='dropoff_y',
aggregate_fn='count',
tile_provider=tile_provider, x_range=(-8239910.23,-8229529.24), y_range=(4968481.34,4983152.92))
chart2 = charts.bokeh.bar('passenger_count', data_points=9)
Create a dashboard object
[9]:
d = cux_df.dashboard([chart1, chart2], layout=double_feature, theme=cuxfilter.themes.rapids, title= 'NYC TAXI DATASET')
[10]:
#dashboard object
d
[10]:
Starting the dashboard
d.show(‘current_notebook_url:current_notebook_port’) remote dashboard
d.app(‘current_notebook_url:current_notebook_port’) inline in notebook (layout is ignored, and charts are displayed one below another)
Incase you need to stop the server:
d.stop()
[11]:
# preview
await d.preview()
Export the queried data into a dataframe
[12]:
queried_df = d.export()
no querying done, returning original dataframe