Probabilistic regression#
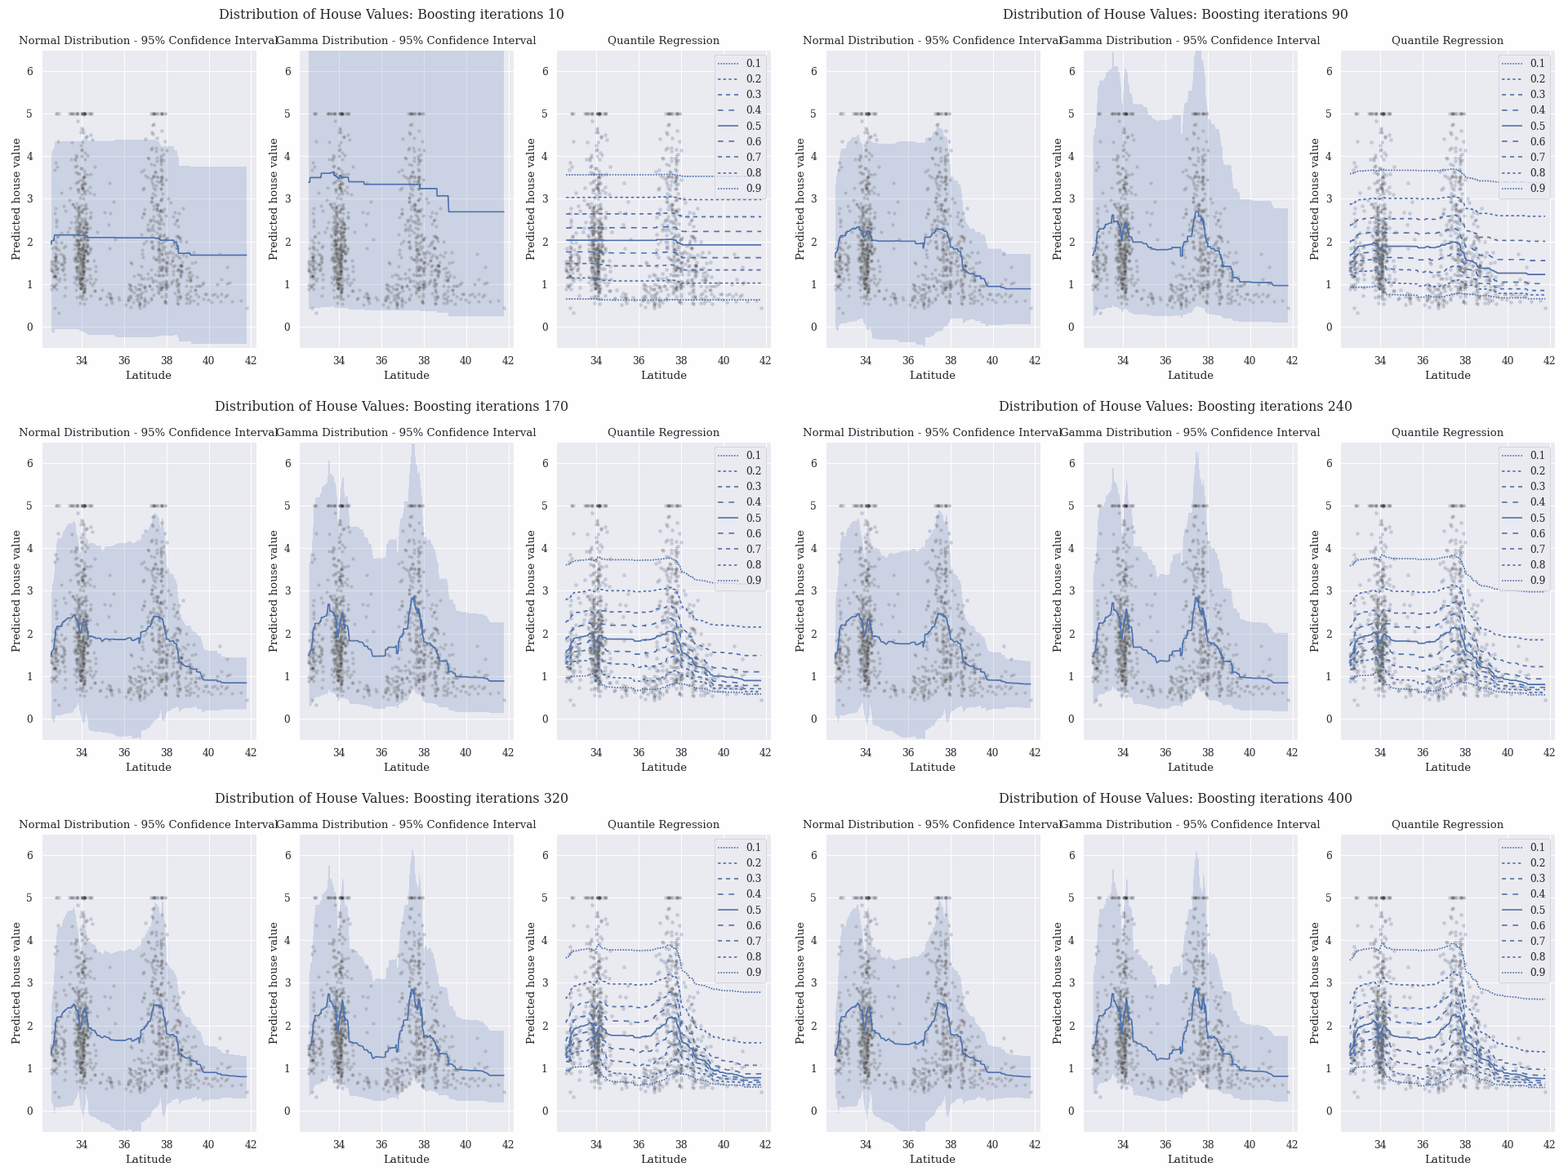
This example applies probabilistic regression objectives to the california housing dataset. For illustrative purposes we use a single dataset feature (latitude) and show how the distribution of the target (house values) varies as a function of latitude.
Running the example produces a gif animation. This animation shows the boosting algorithm adapting the distribution over many iterations to fit the dataset.

The shaded area on the left hand figure shows the 95% confidence interval. The right hand example shows different quantile values.
Notice that the normal distribution is symmetric about the mean, while the data is somewhat skewed. To better fit the data we can also use quantile regression, which is able to model the skewed distribution of the data. A Gamma distribution is another possibility that can fit well for skewed, strictly positive data.